Home › Guides › Market Brief · UPS Earnings
UPS raised its outlook while U.S. daily parcel volume fell
Ahead of holiday shipping, the useful question is what UPS earns from each package—not just how many packages move through its network.
In this guide


Revenue growth was not a daily-volume rebound
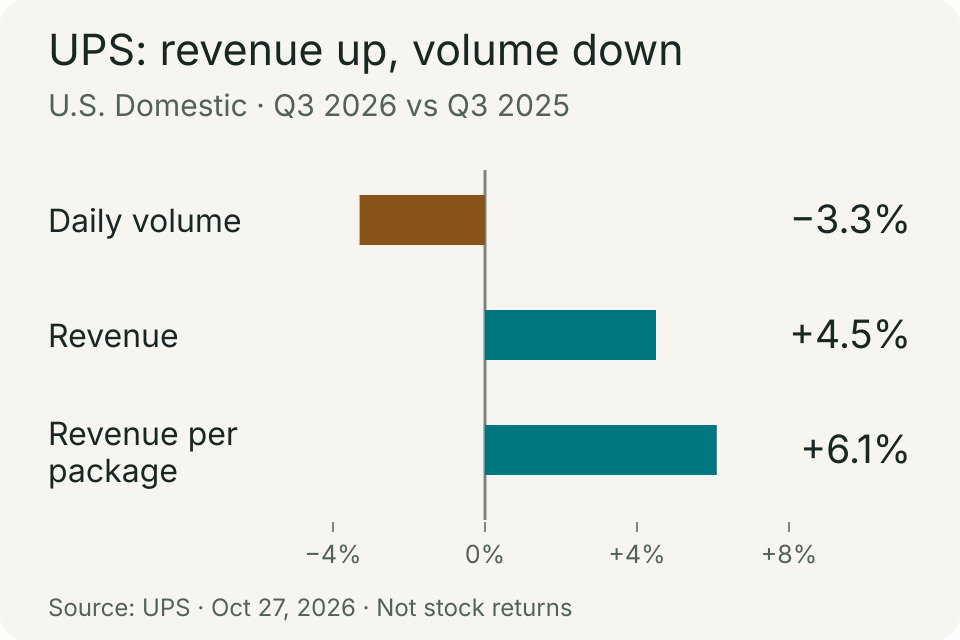
UPS’s October 27 financial schedules show U.S. Domestic revenue of $14.865 billion, up 4.5% year over year. Average daily package volume was 15.621 million, versus 16.150 million a year earlier: a calculated decline of about 3.3%.
The comparison uses daily averages. The quarter had 65 operating days versus 64, so the daily decline is not the same as the change in total quarterly packages. Revenue per piece rose 6.1%.
Higher revenue per package was not all pricing power
The earnings presentation attributes about half of U.S. revenue-per-piece growth to base rates and customer mix, and the remainder to higher fuel rates. UPS also says overall daily volume declined partly because of deliberate reductions in certain business, while small-business daily volume grew 3.7%.
Our reading: these results are more useful as evidence about UPS’s changing business mix than as a clean measure of economy-wide demand. A fuel-related increase in revenue per package does not, by itself, show that customers accepted an equivalent increase in the base shipping price. Nor does a deliberate customer reduction establish that consumers are buying less everywhere.
The outlook improved, but the measures need labels
Comparing the July outlook with the October release shows what management changed:
| Measure | July 28 → October 27 |
|---|---|
| Consolidated revenue | $91.2 billion → $92.6 billion |
| Non-GAAP adjusted operating profit | $8.65 billion → $8.75 billion |
| Non-GAAP adjusted diluted EPS | $7.22 → $7.28 |
The U.S. segment presentation puts adjusted operating margin at 7.0%, up from 6.4% a year earlier. Its GAAP operating margin was 6.1%. Keep those labels attached: the adjusted result excludes specified items, and the release provides a reconciliation.
Our reading: the improvement deserves attention, but neither a guidance increase nor an adjusted margin proves how the stock should be valued. Comparing only the most favorable measure would lose part of the earnings picture.
What would make the next update informative
For the holiday quarter, a useful follow-up is whether the same pattern persists. Three comparisons would help distinguish a stronger network from a stronger demand backdrop:
- Volume: compare daily package counts with the same quarter last year and identify customer categories that grew or shrank.
- Revenue per piece: separate base rates and customer mix from fuel effects before interpreting the increase as pricing power.
- Margins: compare GAAP with GAAP and adjusted with adjusted, then read the reconciliation and changes in operating costs.
These are questions for the next data release, not predictions. The practical insight is to keep demand, revenue quality and cost performance separate instead of treating one rising number as proof of all three.
For options research, the same distinction applies between a business result and an executable quote. Our mark-price versus exit-price guide explains why a displayed contract valuation is not a guaranteed sale price.